While Figure 1 shows how much force is transmitted, Figure 3 shows where that force enters the shoe. Together they form the picture of a stabilised power transfer.
Figure 3 from the study
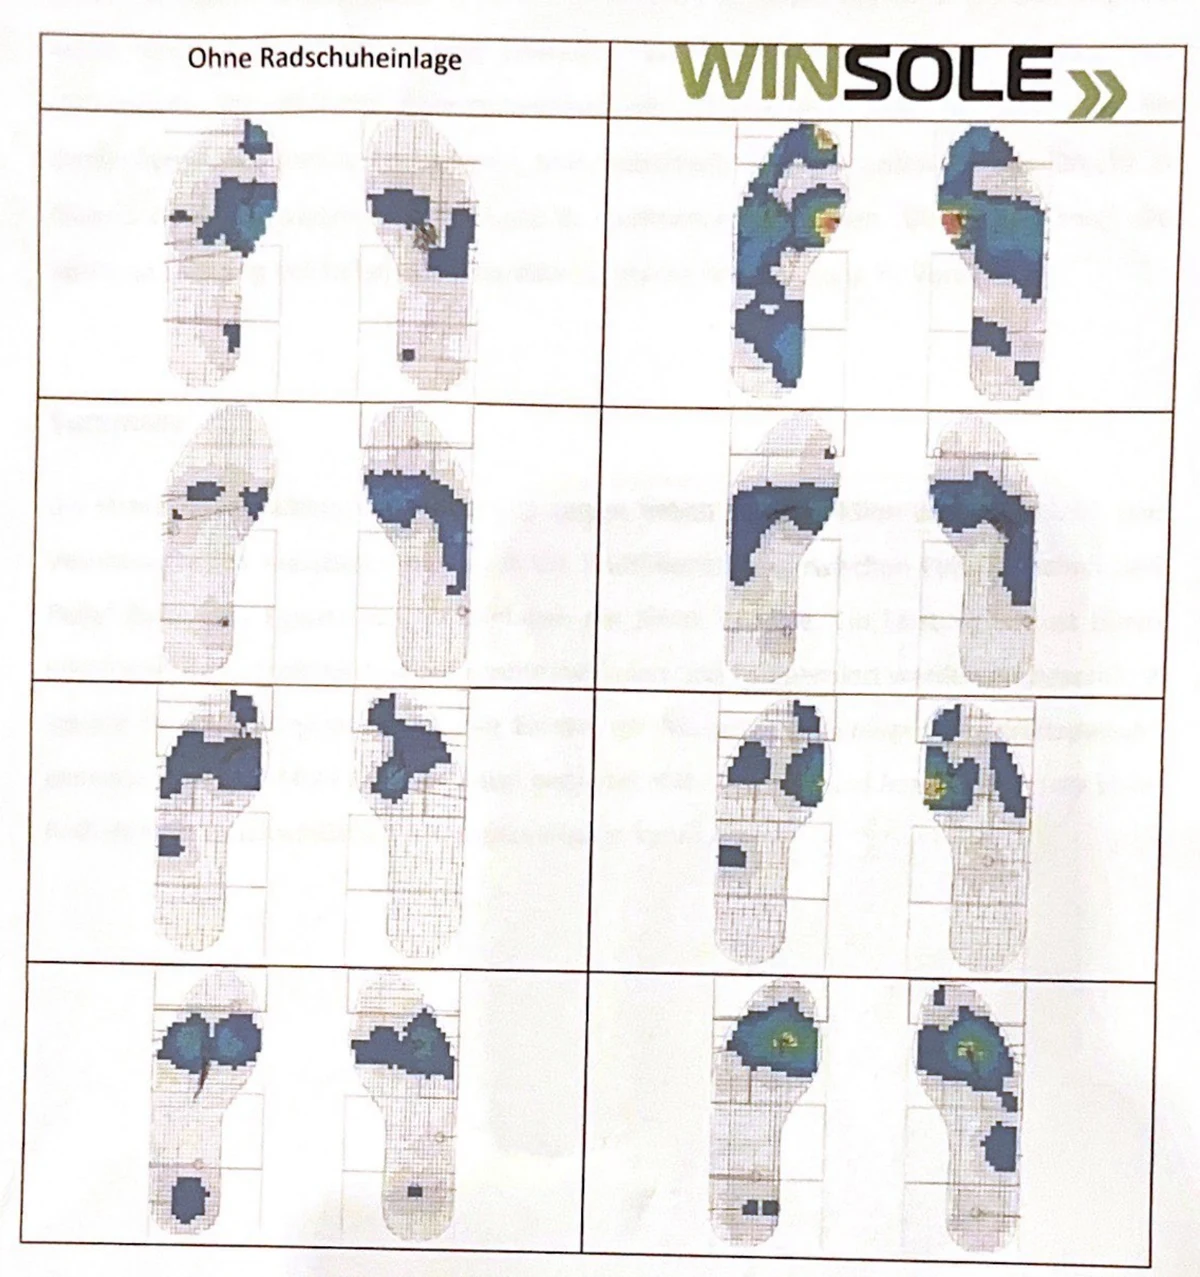
How to read the pressure scans
Each row shows a measurement pair of left and right foot. The left column comes from the measurement without an insole, the right column from the same measurement with the Winsole insole. Coloured areas mark loaded regions of the sole; lighter areas carry hardly any load.
Observations of the study
- The carbon core of the Winsole insole concentrates and stabilises the transmitted force towards the first metatarsophalangeal joint (big toe joint).
- The concentration of pressure in this area reduces pressure losses in inefficient regions.
- Support of the foot arches provides constant blood flow in the forefoot.
- Measuring pressure directly inside the cycling shoe makes the stabilisation of force distribution — and thus of power transfer — visible.
Why the big toe joint?
The carbon core of the insole concentrates and stabilises the transmitted force towards the first metatarsophalangeal joint. The study describes two consequences: pressure losses in inefficient regions are reduced, and support of the foot arches provides constant blood flow in the forefoot.
Note on the figure
The figure is a reproduction from the study document. It carries no scale with absolute pressure values; the study evaluates it qualitatively. Quantitative statements rely exclusively on Figures 1 and 2.