The study contains three figures. Two are bar charts with numerical values, the third is an image representation. Each answers a different question.
Figure 1 — how much force?
- without insole
- with Winsole
X axis: the nine individual measurements.
Y axis: total force in newtons (N).
Bar pair: left bar without insole, right bar with the Winsole insole — same person, same measurement.
The correct reading is the comparison within a bar pair, not between different measurements. That measurement 3 shows higher absolute values than measurement 6 says nothing about the insole but about the performance class of the person.
Figure 2 — distributed how?
- without insole
- with Winsole
X axis: again the nine measurements.
Y axis: deviation from the optimal 50/50 distribution, in newtons.
Zero line: the ideal — both feet contribute equally.
Here the sign does not matter, the distance from the zero line does. A bar at +12 N and one at −12 N describe an equally large imbalance, merely on different sides.
Figure 3 — where exactly?
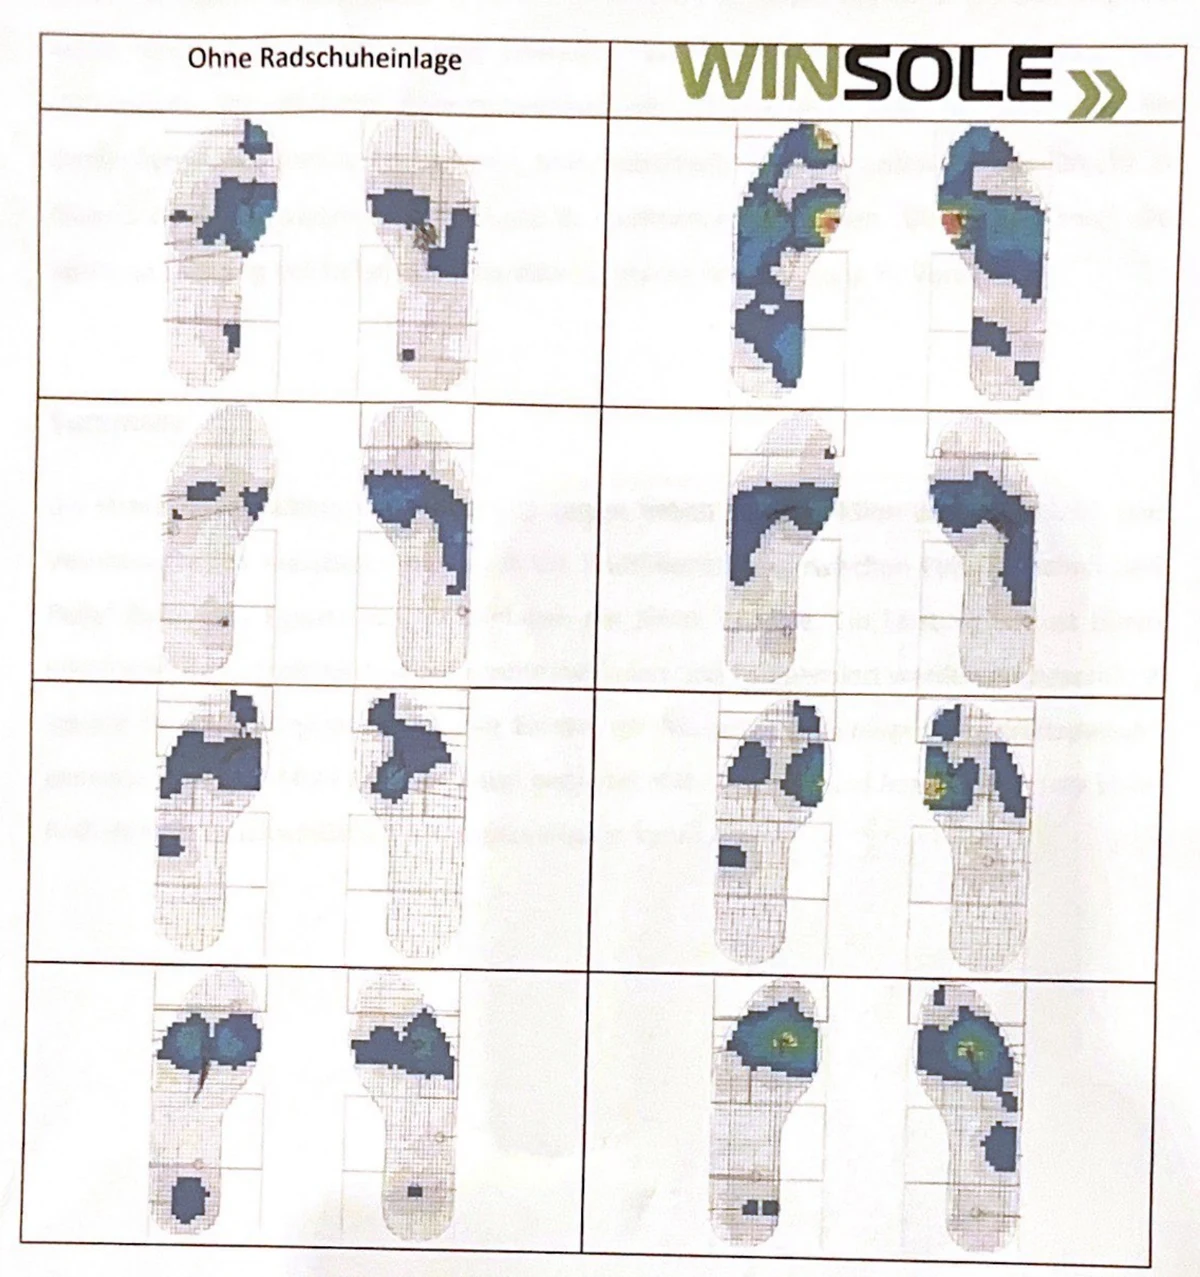
This figure is qualitative, not quantitative. It shows the spatial location of loading: on the left the measurements without an insole, on the right the same feet with the Winsole insole. Visible is the concentration of pressure towards the big toe joint.
- “Taller bars = more watts” — the newton is a force, not power. Conversion is impossible without cadence and crank length.
- “The largest increase is the expected increase” — the range spans 9 N to 180 N; the study predicts no individual case.
- “Figure 3 shows pressure values” — the representation carries no scale of absolute values and is evaluated qualitatively.